
Coca-Cola HBC is one of the largest investors among manufacturers of consumer goods. The company owns 10 modern factories for the production of soft drinks and juices across one of the countries in the CIS region. Coca-Cola HBC purchases 96% of all ingredients and production materials from local suppliers.
firstBit | NFP is a large consulting company located in the CIS region. Three of its key business areas are planning, risk analysis, and simulation-based optimization solutions development.
Coca-Cola HBC is managing and improving its distribution network in one of the CIS countries. This approach facilitates business flexibility and reliability but complicates regional product flows. They are influenced by the instability of regional transport rates, seasonality, and excessive centralization. Besides that, an increase in supply chain complexity boosts storage, transportation, and delivery costs.
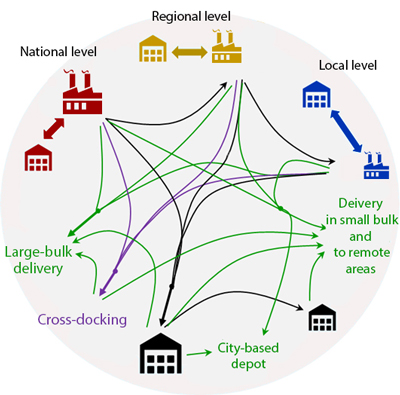
The multilevel nature of the company’s supply chain also added to its complexity. For instance, the products could be delivered to wholesale or retail customers directly from a plant, via cross-docking, or using a regional warehouse.

To cut costs and ensure logistics optimization across the country, Coca-Cola HBC's management decided to create a model of the current supply chain. The model had to consider corporate push-pull policy at different supply chain levels and help optimize warehouse inventory.
Development of the model was assigned to the NFP consulting company. The model was supposed to help:
This supply chain optimization approach would enable Coca-Cola HBC to scale up modern supply chain planning practices to the whole country’s network, increase its capacity, and gain deeper insight into logistics investments.
When selecting software for supply chain and logistics optimization, Coca-Cola HBC got familiar with several tools and opted for anyLogistix. Compared to its competitors, anyLogistix supply chain optimization software provided more opportunities for logistics optimization and would also allow the consultants to model supply chain scenarios in detail. Also, the consultants and the customer appreciated the software’s easy-to-use interface, built-in set of reports, and its extensibility.
The consultants wanted to apply the developed model and anyLogistix supply chain optimization to:
At the beginning of the project, the consultants examined data on supply chain performance and came up with a model concept that included architectural design and a hierarchy of dimensions and metrics. A risk management procedure was developed as well.
In the second phase, the project team built a model prototype and tested it on limited data. The test supply chain optimization scenarios allowed for estimating the risks of scaling the model for different planning horizons and the validity of model operation compared to real processes.
To speed up testing of a large number of scenarios, some of them were created automatically. For this purpose, the consultants created scripts in Python to verify the input data and linked lists of objects, as well as to develop test scenarios from the templates.
Click the image to enlarge
In the third phase, the team started scaling up the developed scenarios. To that end, they created a supply chain model of 200,000 clients. Next, they joined those clients who were in close vicinity to each other into clusters using anyLogistix Greenfield Analysis capabilities. When analyzing routes to clients, the algorithms excluded economically inefficient routes. For suitable routes, the required number of vehicles and their loads were calculated.
Within this phase, the team of model developers were tackling five business challenges:
Choose production strategy
The team wanted to gain insight into how the changes in the performance of mutually redundant production sites would affect the operations of the entire supply chain. To that end, production constraints for each site, including a range of items and line productivity limitations, were reflected in the model, and the values of the supply chain KPIs were defined. Then, the team took advantage of anyLogistix supply chain optimization capabilities and calculated optimum constraints for sites based on their capacity and demand.
Choose supply policies
To address this challenge, the consultants optimized product flows at different levels of the supply chain, taking into account production constraints, warehouses and transport capacity, safety stock, frequency of delivery and other factors. They also compared different supply strategies: direct supply by different means of transport, storage in production sites warehouses, local delivery to third-party logistics provider’s warehouses, cross-docking, and indirect supply via distributors.
Test the improved network of warehouses
Supply chain optimization experiments enabled the consultants to calculate the optimal number and location of second-tier warehouses. To prove the experimental results' effectiveness, they compared the costs of the current warehouse topology and the suggested updated variants. In doing so, they took into account two transportation options: by distributors and cross-docking.
Plan last-mile delivery strategy
Previously, the customer company supplied retailers directly but considered other options for product supply through regional and federal distribution centers (DCs). The consultants used the model to estimate the cost savings that could be made by switching to the new retailer maintenance strategy and the number of trucks that would be needed in this case.
Test the push-pull strategy and calculate safety stock
The project team developed an extended MRP logiс of stock movement based on demand forecasting and embedded it in the model. They tested utilization levels of the partners' 3PL warehouses, which were supposed to maintain the target stock level according to the pull policy. At the same time, the volatility in production output was smoothed by the push policy of buffer product stock at the plant warehouses. The team also calculated the inventory level in each warehouse and peak periods of warehouse utilization. It was also estimated how the service level would change with new target values of safety stock, available vehicles, and their load.

The supply chain optimization model developed in anyLogistix enabled the consultants to manage the supply chain allowing for different planning horizons. Coca-Cola HBC obtained a decision support system that could test many logistics and production hypotheses strategies in a few hours. As an output, the user would get a new supply chain configuration, the required number of vehicles, and their optimal load. The company’s supply chain managers now can choose the most profitable points for direct delivery relying on detailed calculations of expenses for each store of the network.
The model can be easily readjusted, so the Coca-Cola HBC specialists will be able to use it to test out new supply chain configurations aiming to: