Logistics includes planning and executing the storage and movement of goods between different points in the supply chain. Logistics coordinates facilities, people, equipment and other resources to ensure products move when they’re supposed to and there is space for them at the next stop.
– Oracle NetSuite
Logistics network design is an ongoing process that involves locating new facilities like distribution centers, warehouses, and production sites, determining the flows between them, and managing costs. Having an optimal design is essential for the logistics network to be reliable, cost-effective, and prepared for supply and demand uncertainties.
In other words, the process consists of two stages: strategic and tactical.
For strategic decisions, such as an estimation of how many new facilities to open and where to locate them, managers use greenfield analysis (also known as center of gravity or facility location analysis).
For tactical challenges, managers use network optimization. It aims to find the best setup of factories and distribution centers in the supply chain. The goal is to balance supply and demand while minimizing costs. By using optimization techniques, managers can compare different network configurations and determine which one will bring the highest profits.
But that is not the end of it. You, as a manager, would certainly want your logistics network to be resilient – able to quickly recover when disruptions hit. For that, you’d need to include randomness in it by simulating the operations and seeing how disturbances may affect the performance.
Some logistics specialists still do these calculations in Excel spreadsheets, but with large-scale projects, there are easier and faster tools to use. See why Excel may not be a suitable solution for supply chain and logistics projects.
Now that you know what logistics network design is, let’s take a closer look at an example of a US distribution network, illustrating every step of the process done in anyLogistix supply chain design and analysis software.
Suppose a company plans to start selling home and garden products, such as lighting, large home appliances, furniture, gardening equipment, and small appliances. It has 70 customers all over the US and a periodic demand – a certain volume of products is ordered every 5 days.
The ordered products must be delivered to customers within 2 days, so the customers should be within 1000 km of potential distribution centers. For detailed settings, check out the documentation.
Result
You can set these parameters in tables in anyLogistix software and run a Greenfield Analysis Experiment. In this example, you get four potential locations for distribution centers (suggested regions). If needed, you can make roads visible too. Data on product flows, distance coverage by demand, and demand coverage by distance are available after the experiment has run.
Default map view with customers before running the GFA experiment (click to enlarge)
Map view with new distribution center locations (click to enlarge)
Now you have a suggested list of new distribution centers in four regions: North (Oregon), West (Nevada), South (Texas), and East (Virginia). But let’s say you consider only three regions: West, South, and East. There are several possible locations for the new DCs in each region, but this time you need to find the optimal (one DC per region) one in terms of profit.
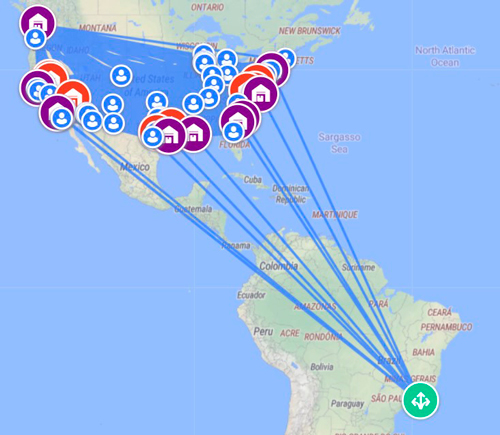
At this stage, a supplier in Rio de Janeiro, Brazil, is added. Products are transferred from the supplier to the DCs through Ports located in the US and distributed along the coast. Finally, the products are shipped to the customers from DCs. In the current scenario, only one port can be selected for the final supply chain configuration.

One supplier and potential DCs and ports
Before you run a Network Optimization Experiment in anyLogsitix, you’d need to set the characteristics for DCs and Ports. These are, for example:
For detailed settings, check out the documentation.
Result
The result provides several supply chain network configurations with detailed statistics. The best choice is to open DCs in Lynchburg, Reno, and Austin and use the Port of New Orleans for transshipment.
Three out of several logistics network design options suggested by anyLogistix (click to enlarge)
Map view of the best logistics network design in anyLogistix (click to enlarge)
For detailed information on the best configuration, you can check other tables, such as Product Flows, Other Costs, Storage by Product, and more.
Product Flow table in anyLogistix (click to enlarge)
Other Costs table in anyLogistix (click to enlarge)
The result of the network optimization experiment is often converted to a simulation scenario to check the logistics network’s performance in dynamics by analyzing statistics. You can add more constraints and characteristics to make the virtual supply chain more realistic. For example, you can define vehicle types to transport the products and select the shipping type and load ratio for them.
Additionally, to identify potential risks and see how your network would perform if any disturbances happened, you can run a Risk Analysis Experiment in anyLogistix.
We hope our simple example helped you learn what logistics network design is and how you can perform it in just a few steps. Start with identifying locations for your DCs or other facilities, then find an optimal configuration, analyze it in dynamics, and fine-tune it till you create the most profitable and resilient logistics network.
Now that you know the workflow, hone your skills and try designing a logistics network yourself. Download the free anyLogistix software version for personal learning, import the example from this blog post – US Distribution Network, which you will find on the welcome screen, and play around. For reference, check out this detailed guide.