Read also: Addressing last-mile delivery optimization with simulation


The brewing company needed to optimize its beverage logistics network and transportation strategy while reducing total costs across a highly seasonal distribution network.
A consulting company, TBS Development, used anyLogistix as supply chain software for food and beverage to model the existing supply chain and evaluate alternative warehouse configurations, locations, and transportation strategies.
A major European brewing company operates a single plant producing 30 million dal (300 million liters) annually. The company serves more than 15,000 delivery points across its domestic market, as well as export customers. Its network includes 10 distribution and 8 storage warehouses, with a mix of owned, rented, and third-party facilities. All transportation is outsourced, with different tariffs for city and intercity deliveries.
Managing beverage logistics at this scale requires balancing warehouse capacity, customer locations, transportation costs, and seasonal demand. The company wanted to improve logistics efficiency and determine whether its existing warehouse network, including the number, locations, and capacities of facilities, was optimal.
The project was carried out by TBS Development, a consulting company based in Kazakhstan and operating across Central Asia and Europe.
The project team needed to determine the optimal number and locations of warehouses, as well as their capacity, while reducing both fixed and variable logistics costs. They also needed to optimize warehouse-to-warehouse and warehouse-to-customer transportation routes and develop an actionable plan for implementing the selected network configuration.
The challenge was not simply to identify the cheapest network configuration. The team had to account for seasonal demand, different transportation tariffs, warehouse capacity, and customer locations. They also needed to balance the trade-offs between last-mile delivery, transportation between the factory and distribution centers, and warehouse-related costs.
The company therefore needed a way to evaluate the entire beverage supply chain rather than optimize individual logistics decisions in isolation.
TBS Development used anyLogistix as supply chain software for food and beverage to create a digital twin of the company's production and logistics chain.
This enabled the team to test alternative network structures, optimize warehouse locations and flows, and identify the configuration that best met operational requirements.
For a complex food and beverage supply chain, anyLogistix provided a practical way to combine detailed supply chain data with network optimization. The platform allowed the team to compare alternative warehouse structures and transportation strategies while incorporating the specific constraints of the client's business.
The project included three models:
The optimization model handled a substantial amount of supply chain data:
The first optimization task was to determine the most effective number of warehouses for the company's beverage logistics network. The team used anyLogistix Network Optimization to evaluate configurations ranging from 7 to 15 warehouses. The analysis considered different customer coverage distances, from 50 to 150 km, and restricted potential warehouse locations to cities with populations above 60,000.
The graph below shows the percentage of demand within the specified distance from the warehouse. In the supply chain structure, there are 3 groups of warehouses with different proportions of "city/intercity."
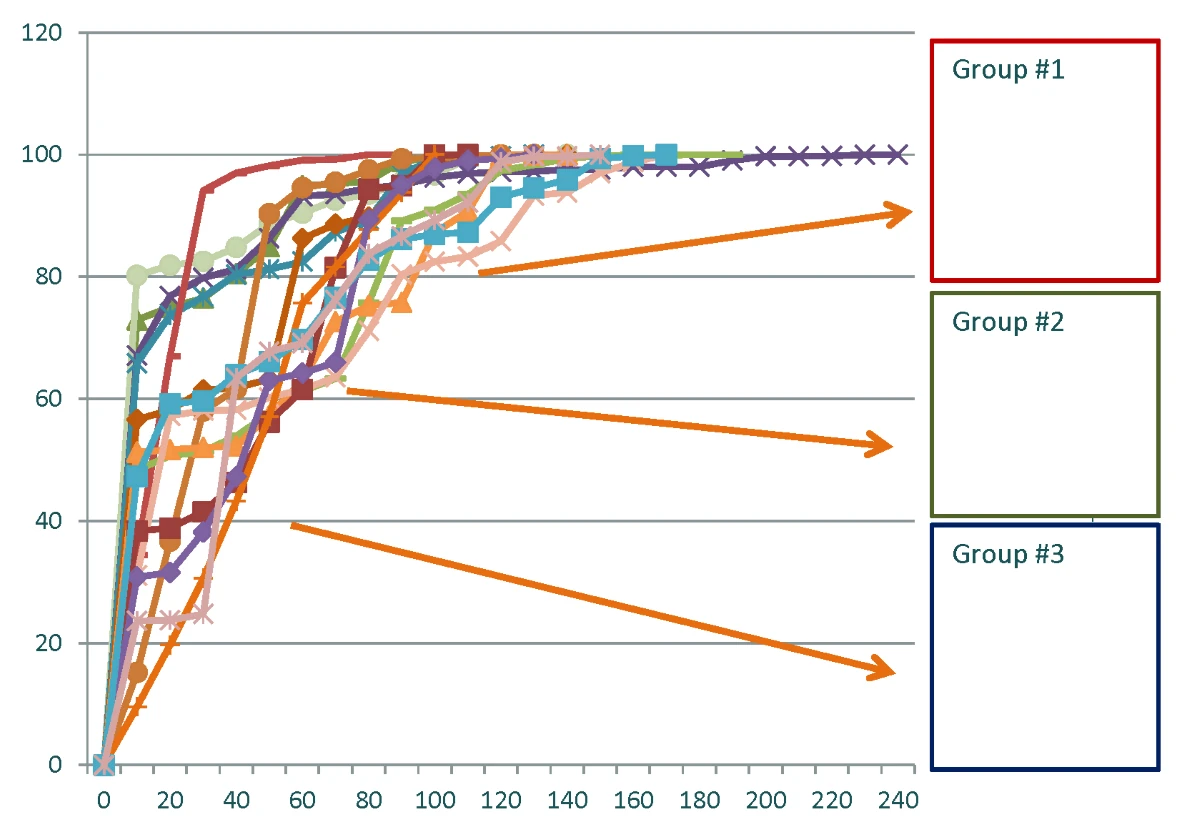
Percentage of demand within the specified distance from warehouses (click to enlarge)
The analysis showed that continuously adding warehouses did not necessarily improve the network. Beyond a certain point, additional facilities increased the share of demand served within a 50 km radius, effectively turning new facilities into local warehouses rather than improving the overall distribution network.
The project team then tested additional scenarios based on the client’s requirements. These included eight configurations using a 70 km customer coverage distance and a higher population threshold of 100,000. The Greenfield Analysis results were used to select five network configurations ranging from 10 to 15 warehouses for further analysis.
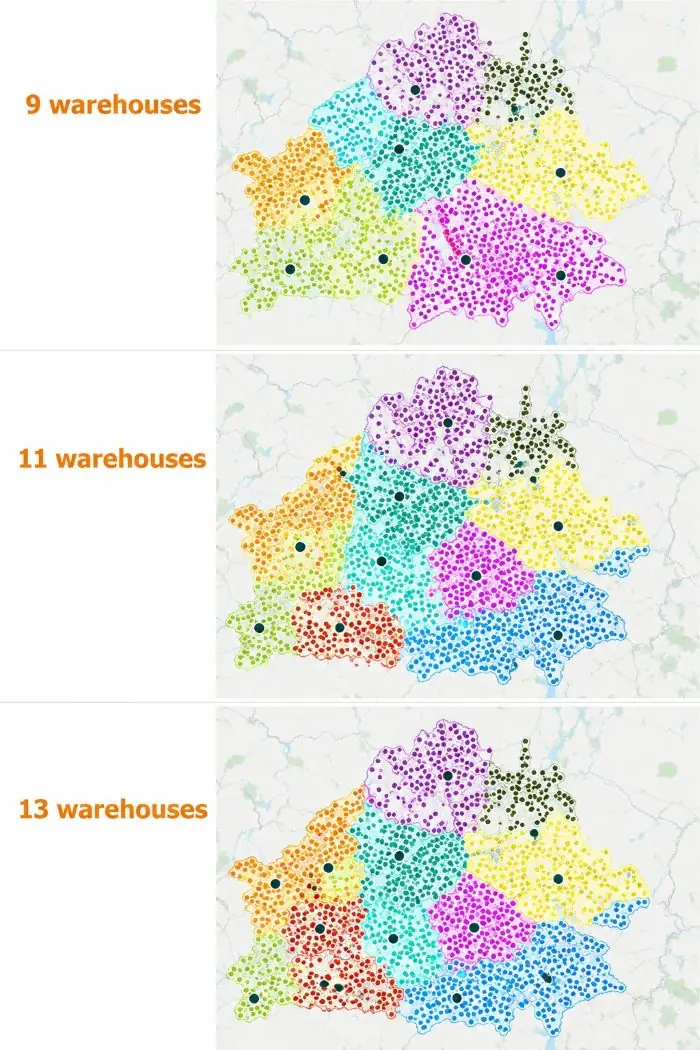
Some options for warehouse locations and their service areas (click to enlarge)
To interpret the alternatives, the team broke total logistics costs into three categories: last-mile delivery, factory-to-distribution-center transportation, and storage and other costs. This made it possible to compare alternative beverage logistics configurations and evaluate their impact on both supply chain operations and total logistics costs.
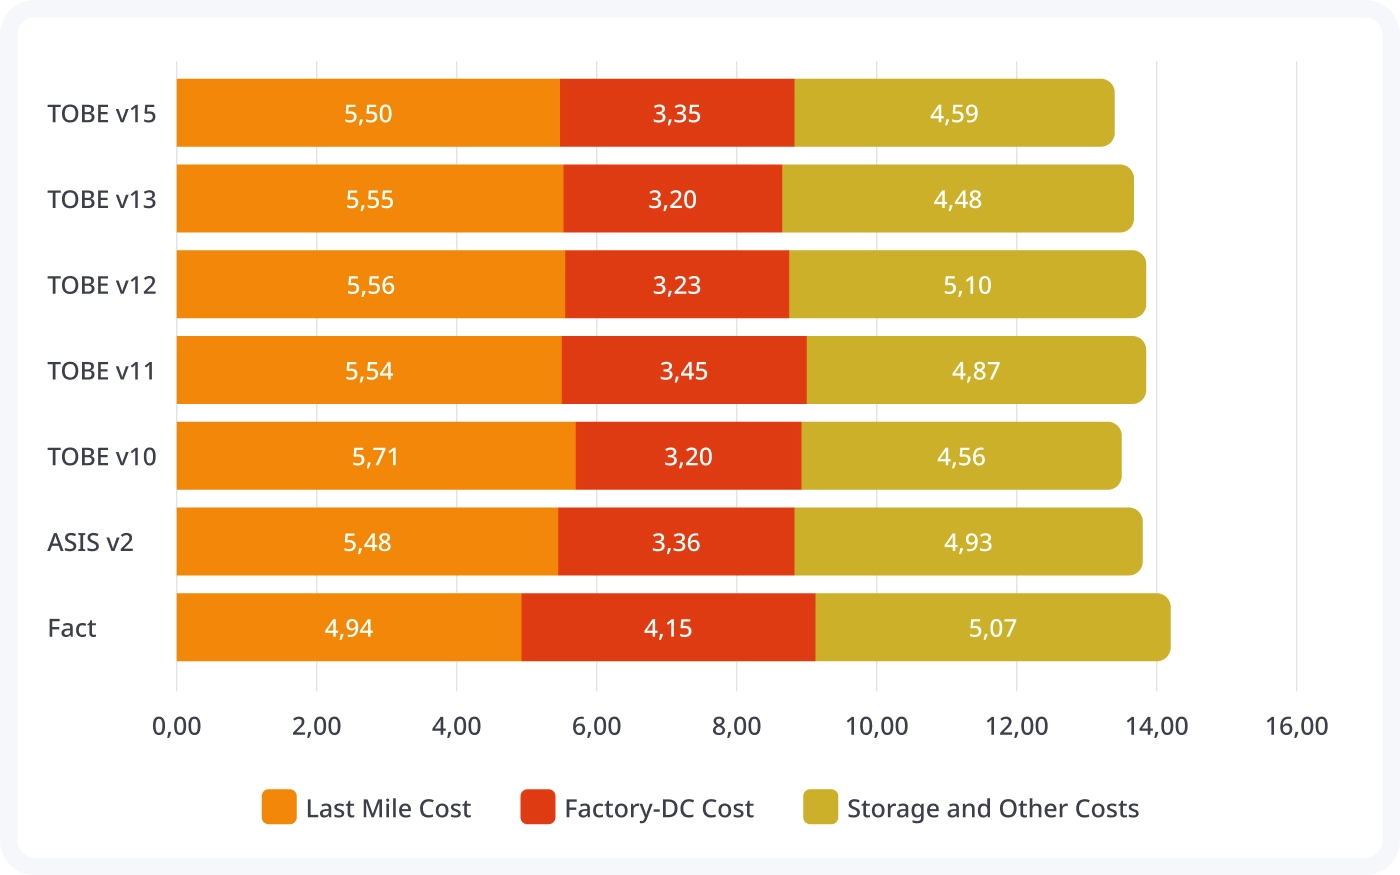
Comparative analysis of variants with total logistics costs by type (click to enlarge)
The optimization produced a measurable opportunity to improve the company's beverage logistics. Even without changing the existing warehouse network, the “as-is v2” scenario (see the table below) showed that optimized transportation decisions could reduce total logistics costs by 1.7%.
For the client, this was an important finding because it demonstrated that cost reduction could come not only from changing the physical network but also from improving transportation decisions within the existing structure.
The network redesign scenarios estimated even greater potential savings. The best-performing “to-be” configuration with 15 warehouses reduced projected total logistics costs by 5.2%, representing an estimated €720,000 in annual savings compared with the current situation.
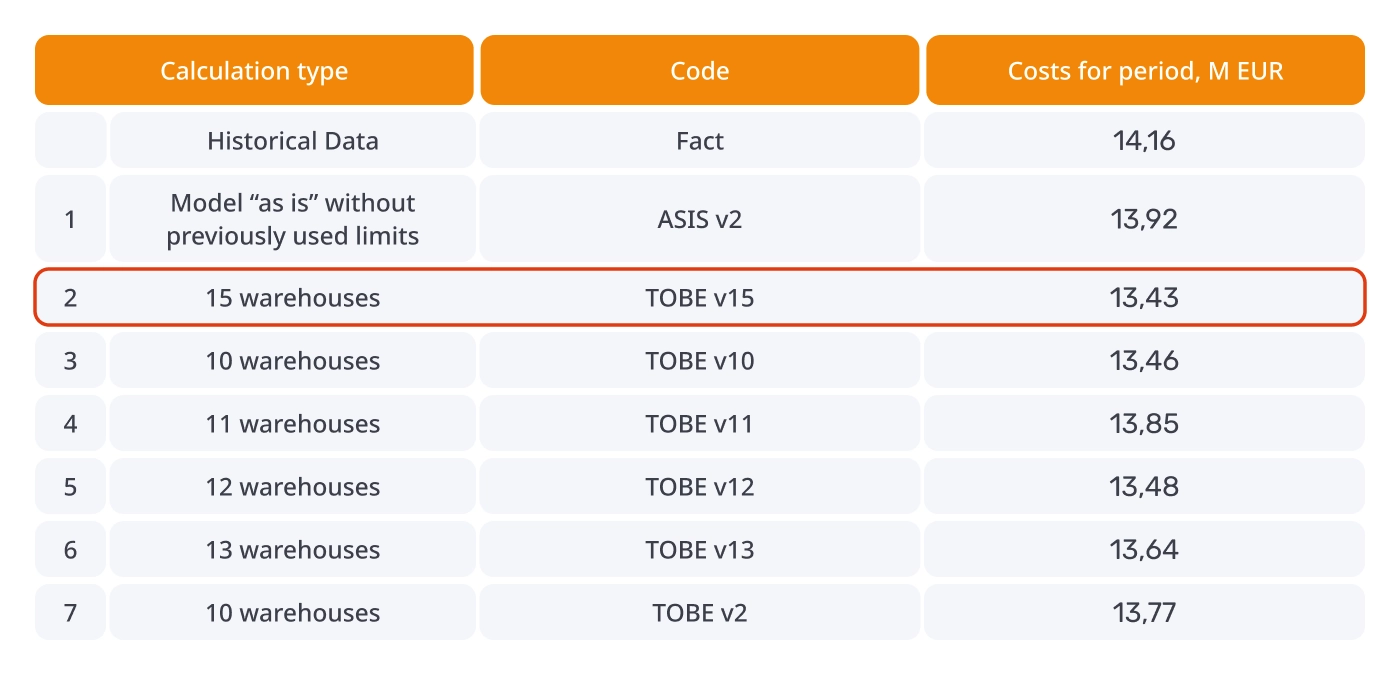
Comparative analysis of variants by total logistics costs (click to enlarge)
The comparison also showed why optimizing individual cost components is not enough. For example, the current network had the lowest last-mile cost but higher factory-to-distribution and storage costs. When all cost categories were considered together, the 15-warehouse “to-be” configuration provided the best total cost reduction.
The project generated additional strategic insights. Under the tariff structure in place at the time, owned warehouses were more cost-effective than leased facilities. The model also identified where individual warehouses should be used and indicated opportunities for adding a warehouse near the factory.
Read also: Improving beer distribution with anyLogistix—another example of how anyLogistix can be used to analyze and improve beer distribution networks. You may also test this example in anyLogistix desktop.
The project also provided the client with a reusable decision-support tool. The company can use it to reassess its beverage supply chain when transportation tariffs or other supply chain conditions change.
This makes the project more than a one-time optimization exercise: anyLogistix gave the client a way to test alternative supply chain designs, quantify their cost implications, and support future network redesign decisions with data.
This case study was presented by Vladimir Sorkin, TBS Development, at the anyLogistix Conference 2026.
The slides are available as a PDF.