
A large European home improvement goods manufacturer was challenged to move one of its plants to another city due to an increase in rent. The supply chain analysts had three possible places for relocation. They had to choose one based on client geography and locations of other production facilities and warehouses. They also had to find warehouse sourcing policies, estimate the budget, and test hypotheses on how to redesign the supply chain to make it more efficient. The primary criteria was transportation costs, while the main sources of uncertainty were demand and transportation times.
The company supplied each region from up to three different warehouses, depending on varying demand, warehouses’ capacities, and available transportation resources. Each warehouse served several regions at the same time, and had to maintain a high service level while keeping transportation costs low.
Besides relocating the production facility, the company was considering whether they had to change their current supply chain design by introducing on-site production at warehouses. The nature of the company’s goods allowed for organizing small production sites at warehouses, which would produce end-goods from the concentrates. Analytical calculations showed that introducing such local sites would pay off in reduced transportation and carrying costs. The researchers’ third goal was to justify the return of investment of this initiative.
 The supply chain was reproduced in a computer model using anyLogistix software. The analysts chose this tool for its simulation modeling capabilities that allowed them to represent the supply chain network design more precisely, explicitly, and transparently than the traditional analytical tools they used.
The simulation model allowed them to take into account randomly determined demand, transportation time variability, and inventory policies, which was not possible with analytical models. Unlike analytical models, the simulation model included all the supply chain details the analysts wanted to take into consideration.
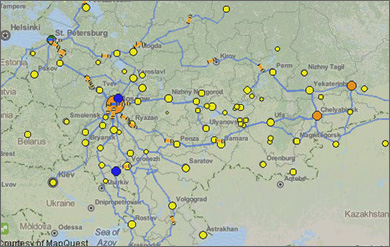
The supply chain model reproduced the current network on the map and positioned the following elements on it:
The model could also be configured to include the prospective sites: three new plant locations and three on-site production facilities attached to warehouses.
Transport routes were built automatically on the map using the real road data. There were two transportation means used (railway and trucks), and the shipments could be either internal or external, and could be paid and managed by the company itself or its customers. These statistics were taken from the historic data.
With each simulation run, the model gathered operational statistics for each supply chain network design element. This data could be accessed on an aggregate network level or for an individual site:
The created supply chain model's logic was validated using historic data from the company’s operations during past years.
 After designing the supply chain model, the analysts began the research phase, which was comprised of three stages.
1st stage: Identifying the best warehouse sourcing policies for scenarios with each possible new plant location.
The same SKU was usually supplied to each region by multiple warehouses in order to maintain high service level, avoid stock-outs, and increase robustness of the network. The anyLogistix model was run multiple times to find optimal sourcing policies for each region and SKU in terms of transportation costs/service level balance. The policies found for each of the three scenarios for new plant location were considered by analysts. These results were then used in the 2nd stage to identify the optimal production facility location.
2nd stage: Finding the best place for plant relocation.
With the optimal regional sourcing policies for each possible plant location, the analysts were able to compare the costs for each of the three cases and find the best one in terms of transportation costs. To make the supply chain model closer to the reality, demand in the model varied with a certain probability during each simulation run, so the analysts ran the model multiple times again to get the probabilistic characteristic for each case.
Varying demand and transportation time allowed them to get more precise results in comparison to the traditional analytical model. Based on mean transportation costs and its probability distribution, the analysts found the best place for plant relocation.
3rd stage: Testing the on-site production facilities assumption.
To find out whether the introduction of small on-site production facilities at warehouses would pay off, the analysts introduced them into the model and did the two previous research stages again.
The statistics of the optimized scenario with the three small sites were then compared to those of the scenario without the sites. The statistics compared included transportation costs and new plant opening and operational expenditures.
The anyLogistix model allowed the home improvement goods manufacturer to identify the best place for their plant relocation based on transportation costs and service level.
Counterintuitively, the supply chain analysts found out that the introduction of on-site production facilities would be ineffective. Site opening costs would not pay off in transportation savings in the near future.
This result could not be achieved without using simulation modeling which allowed for more realistic supply chain design representation in a computer system, in comparison to traditional analytical methods.